Blog ·
Kicking off the #30DayMapChallenge
Every November, mapmakers take on #30DayMapChallenge: one map a day for 30 days, each on a theme. I'm doing it this year with Mapricot's tiles and APIs and MapLibre GL JS. Each map goes in the gallery with a tutorial and a list of its data sources, so you can build your own.
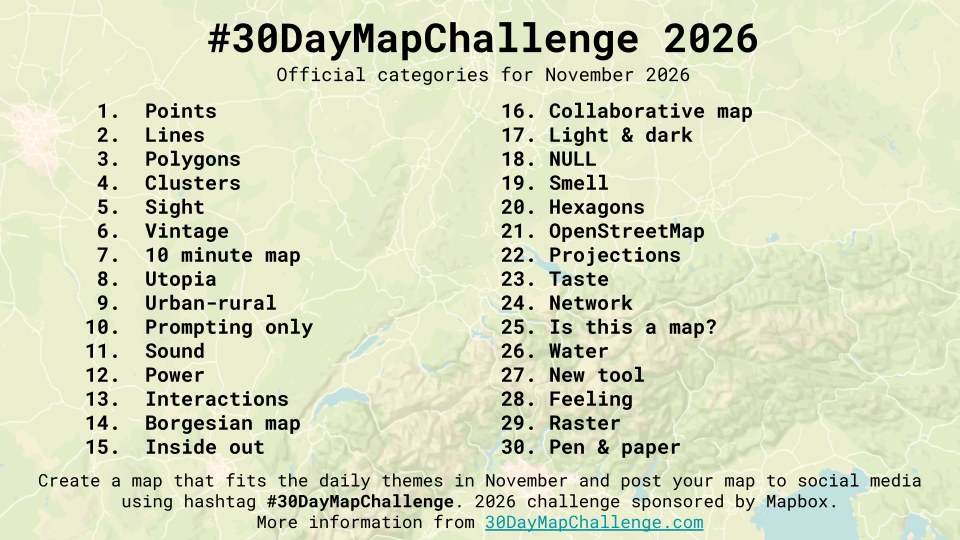
Here are the maps so far.
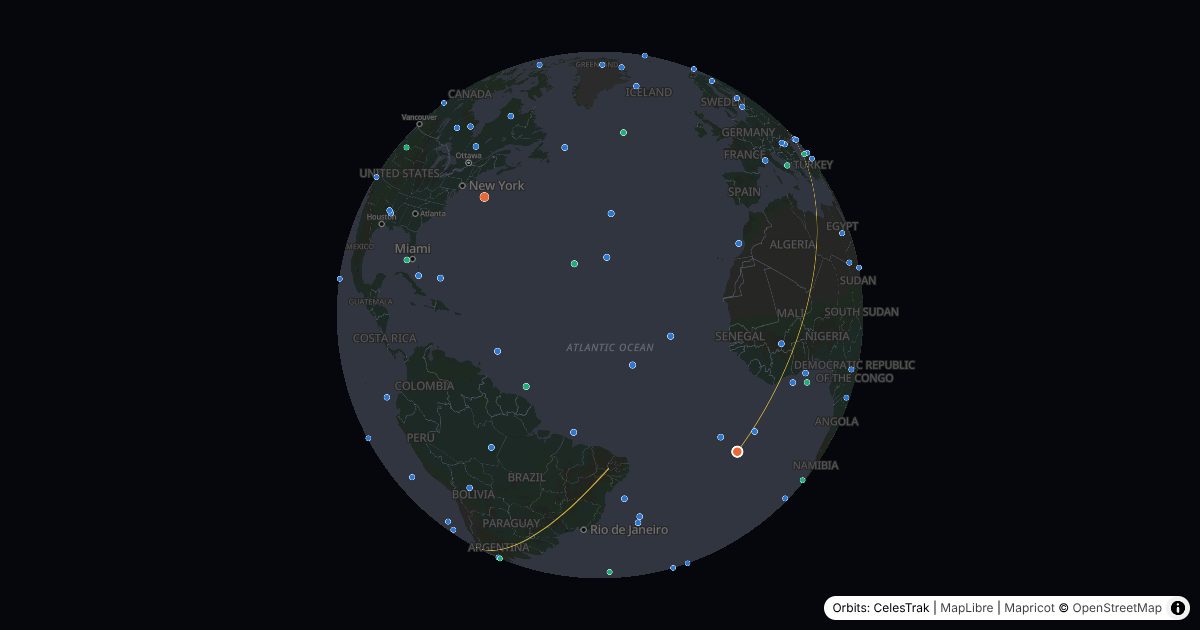
Day 1: Points
The satellite tracker shows about 190 satellites where they are right now: the International Space Station and China's Tiangong, the brightest satellites in the night sky, and the GPS constellation. Click one to draw its next three orbits. The Earth turns beneath it as it goes, so each lap crosses further west than the one before. The orbits come from CelesTrak, and satellite.js works out where each satellite is.
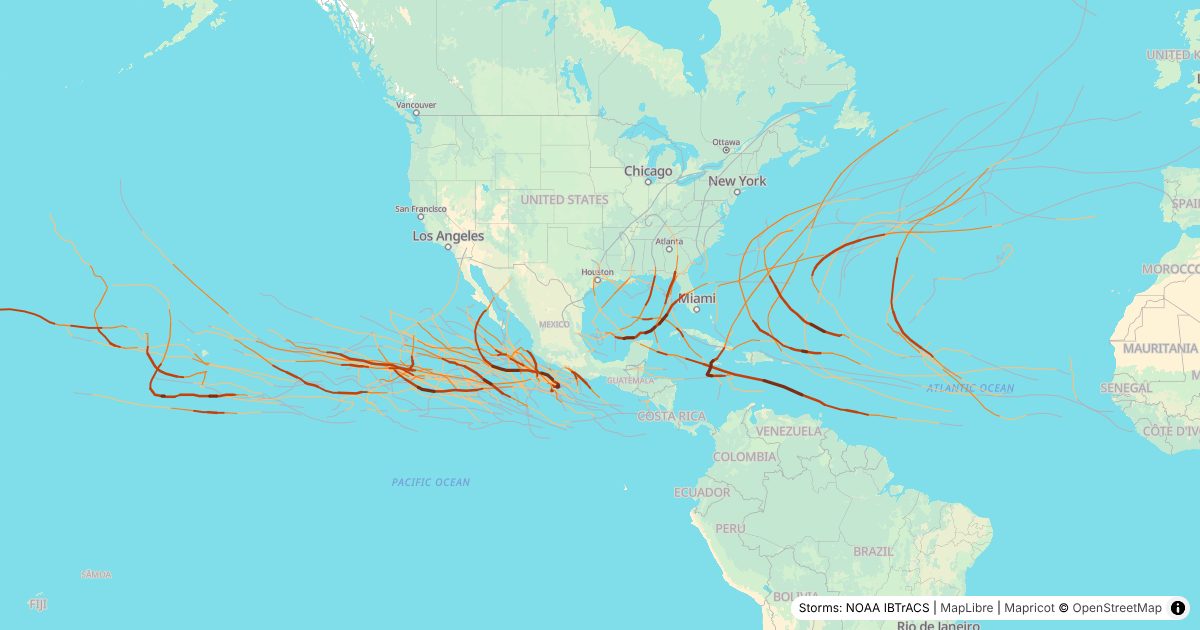
Day 2: Lines
The hurricane tracks map plays each of the last three Atlantic and Eastern Pacific seasons day by day, from NOAA's IBTrACS. Storms appear on the day they formed, with a dot that swells as they strengthen, and each track darkens and widens with the storm. When the season is over, each hurricane's name stays where it peaked.
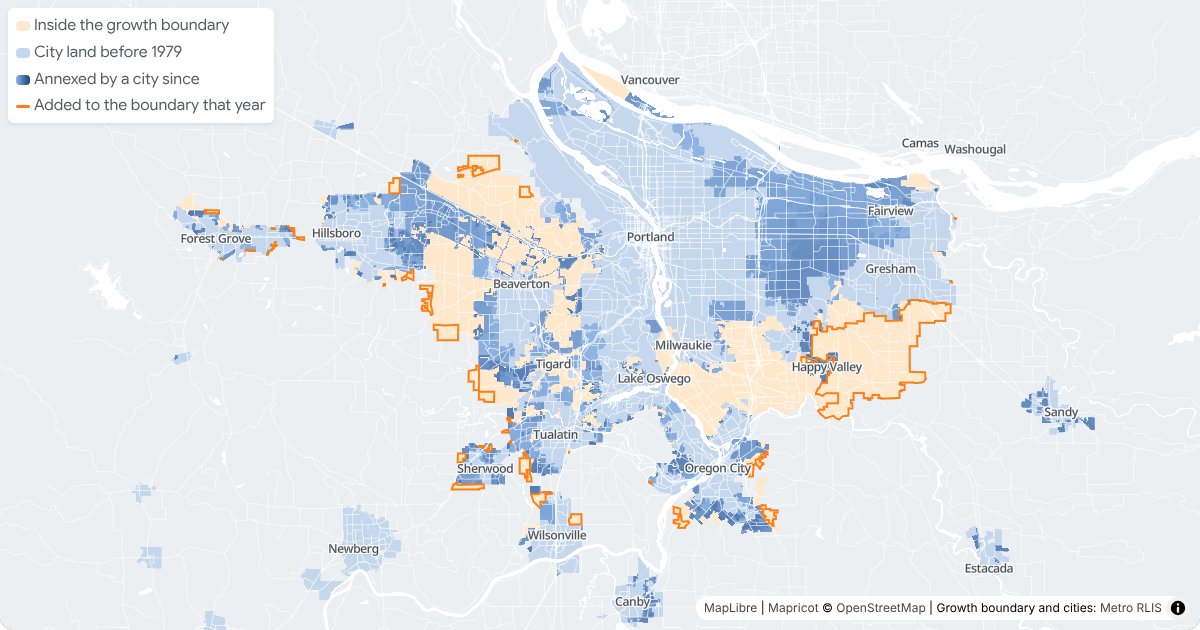
Day 3: Polygons
Oregon requires every city to draw an urban growth boundary, which separates the land it can develop from the farms and forests around it. The Portland growth boundary map plays Metro's boundary from 1979 to today, with the cities filling in up to it, from Metro's RLIS data.
Day 4: Clusters
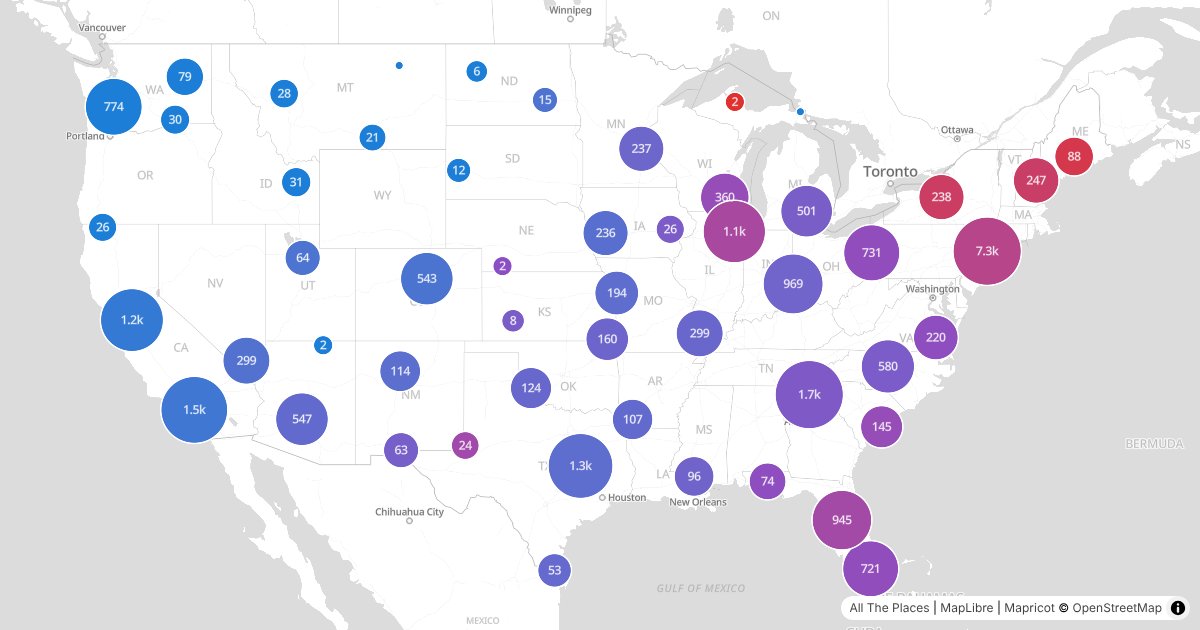
The chain store rivals map puts two rival chains' stores in one clustered map, and colors each cluster by the chain with more stores in it, so the line between their territories shows up on its own. Pick Dunkin' against Starbucks, Sheetz against Wawa, or three other pairs, and look up your town to see who wins there. The stores come from All The Places.
Day 5: Sight
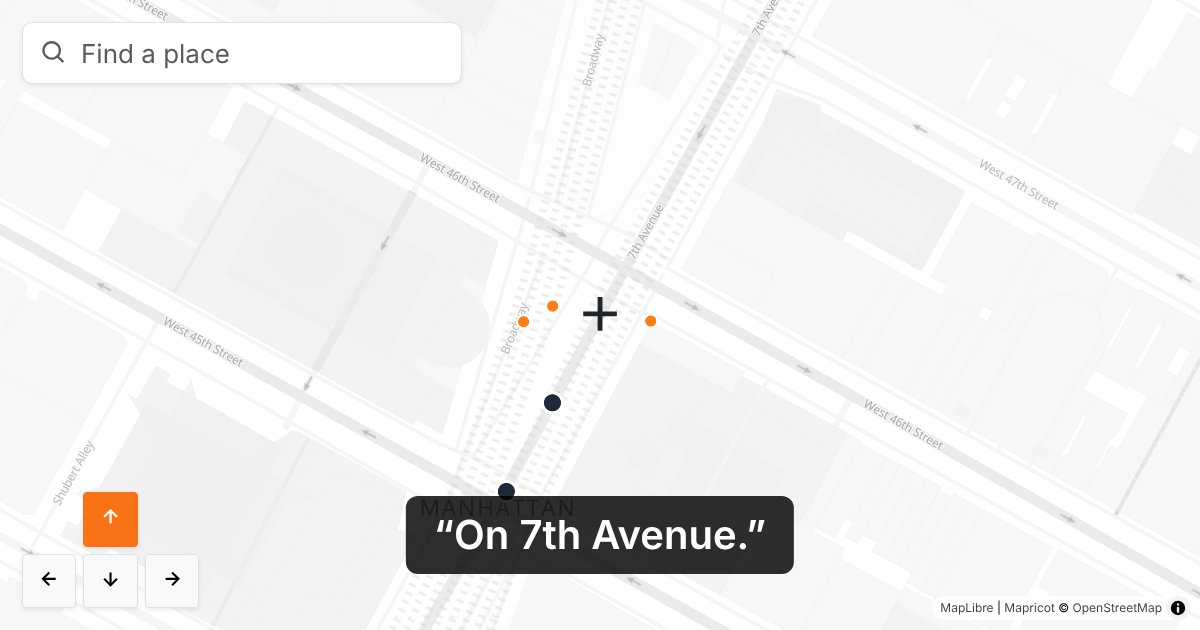
Most web maps aren't accessible. To a screen reader, they're a line of alt text at best. So for sight, I tried out what a screen reader map could look like. It says in words what's under the crosshair: the street, the nearest address, and a few places nearby, with how far away they are and which way. A screen reader reads it out each time the map stops moving, and you walk the map with the arrow keys. If you use a screen reader, I'd love to hear what would make it useful at support@mapricot.com.
Day 6: Vintage
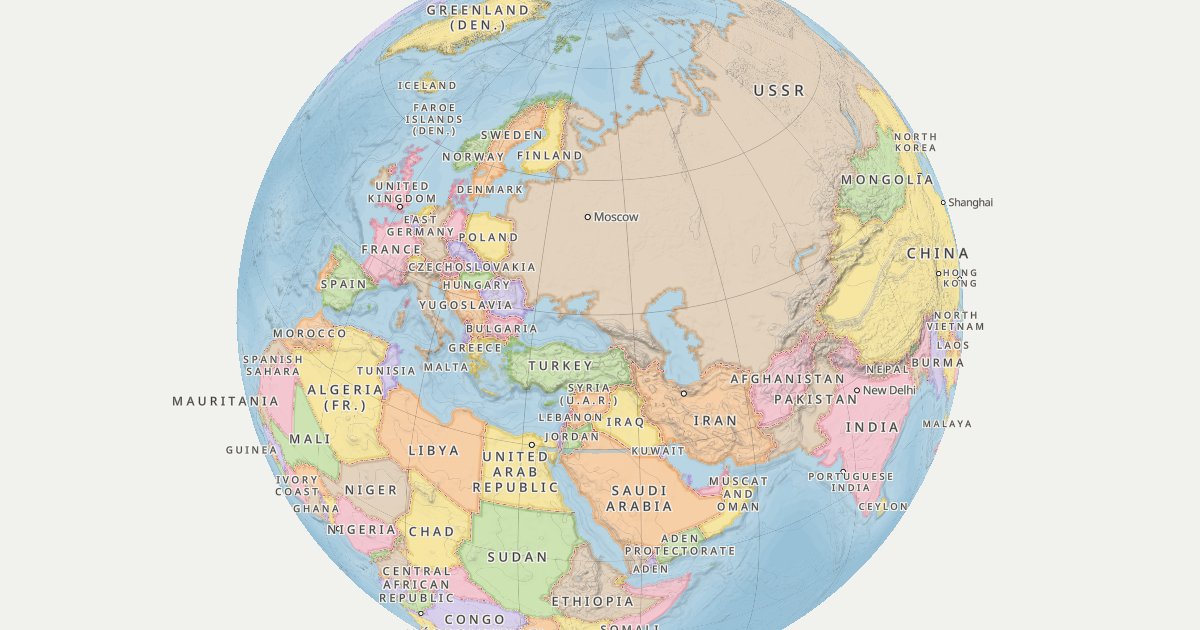
The vintage 1960 world map puts the world of 1960 on an old desk globe, with the USSR, East and West Germany, and Czechoslovakia in pastels, contour lines on land, and depth lines at sea. The borders and coasts come from André Ourednik's historical-basemaps, and the cities have their 1960 names from Wikidata, GeoNames, and Wikipedia, such as Leningrad, Léopoldville, and Peking. Mapricot's tiles don't have elevation, so the contours are drawn in the browser from the free AWS Terrain Tiles with the maplibre-contour plugin.
Day 7: 10 minute map
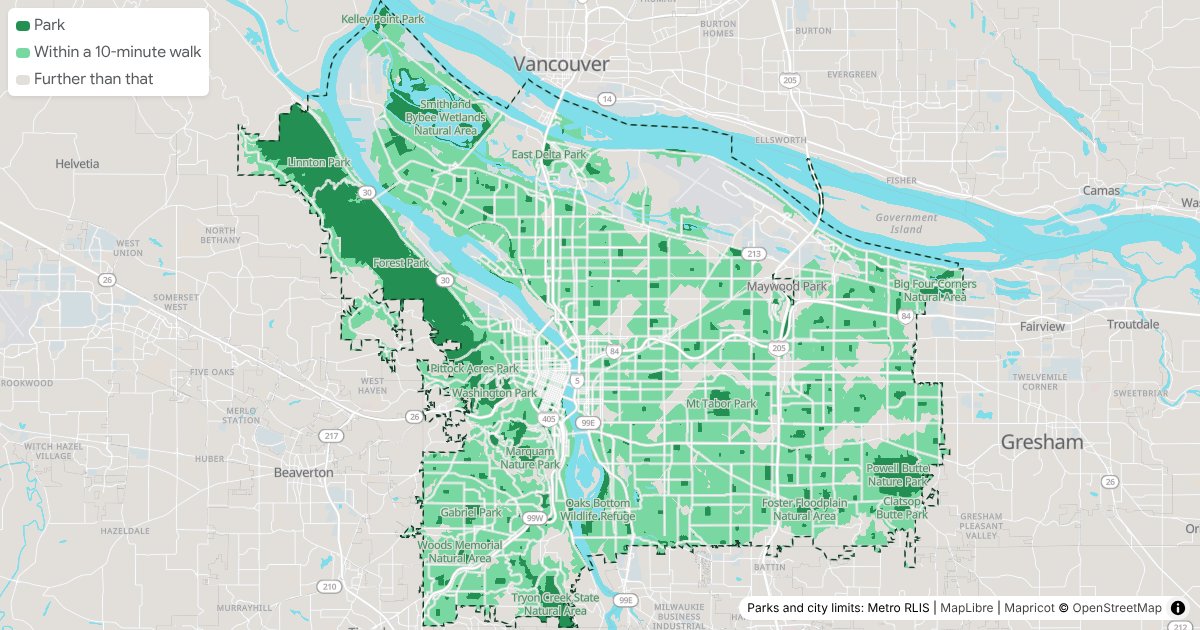
The 10-minute walk to a park map shows everywhere in Portland within a 10-minute walk of a park in light green, with the parks in dark green, on Mapricot's default map. Mapricot's isochrone API takes one starting point, so it's 2,425 walks from points around the edges of 254 parks and natural areas from Metro's RLIS, merged into one. Click anywhere for the 10-minute walk from there and the parks it reaches.
Day 8: Utopia
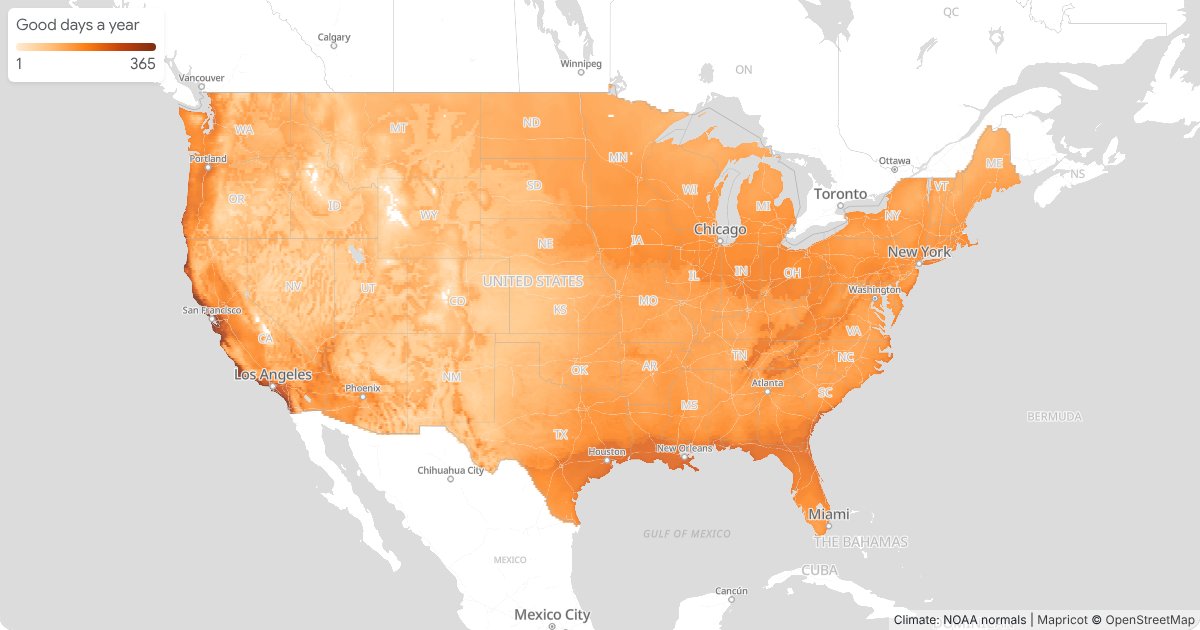
Everyone's utopia has different weather, so the ideal climate map lets you set yours: the coldest low and the hottest high you'll put up with, and how many rainy days a year. The lower 48 states light up by how many days like that each place has in an average year, from NOAA's 1991–2020 climate normals. Click anywhere for that place's year.
Make your own
Each map's page ends with a tutorial that builds a simpler version from plain files. Map tiles are free, the first 250,000 API requests every 30 days are free too, and you don't need a card to sign up.
I'll add the rest of the month's maps to the gallery as I go, and look back at all of them at the end of November.